
Application
The KOTS Application custom resource specification contains vendor-supplied application metadata to enables features such as:
- image branding
- including release notes
- automatic port forwarding
- providing dashboard buttons
- displaying application status indicators
- and displaying custom graphs.
There is some overlap between the KOTS Application spec and the Kubernetes SIG Application spec.
In time, it’s likely that the SIG Application spec will grow to include all the necessary metadata to support the full KOTS features.
In the meantime, enabling features (such as dashboard buttons to the application) requires the use of both the KOTS Application spec and the SIG Application spec.
apiVersion: kots.io/v1beta1
kind: Application
metadata:
  name: my-application
spec:
  title: My Application
  icon: https://support.io/img/logo.png
  releaseNotes: These are our release notes
  allowRollback: false
  kubectlVersion: latest
  kustomizeVersion: latest
  requireMinimalRBACPrivileges: false
  additionalImages:
    - jenkins/jenkins:lts
  additionalNamespaces:
    - "*"
  ports:
    - serviceName: web
      servicePort: 9000
      localPort: 9000
      applicationUrl: "http://web"
  statusInformers:
    - deployment/my-web-svc
    - deployment/my-worker
  graphs:
    - title: User Signups
      query: 'sum(user_signup_events_total)'
title
The application title. This will be displayed on the License Upload screen and in various other places in the KOTS Admin Console.
Example:
title: My Application Display Name
icon
The icon to associate with the application. This will be displayed on the license upload screen and in various places in the Admin Console. There are two options for including icons in the application:
- A public URL for online installs
- A base64 encoded string for air-gapped installation bundles.
Example: public URL to any image resource:
icon: https://avatars3.githubusercontent.com/u/13629408
NOTE: base-64 encoded image strings (must be in HTML <img> tag compatible format ):
Examples:
icon: "data:image/gif;base64,R0lGQBEAPeoAJ -- LOTS OF DATA TRIMMED FOR BREVITY -- z595kzAAOw=="
icon: "data:image/png;base64,iVBORw0KGgoAA -- LOTS OF DATA TRIMMED FOR BREVITY -- BU5ErkJggg=="
icon: "data:image/jpeg;base64,/9j/4RiDRXhp -- LOTS OF DATA TRIMMED FOR BREVITY -- oElFTkSuQmCC"
releaseNotes
The release notes for this version. These can also be set when promoting a release.
Examples:
releaseNotes: "Short release notes."
releaseNotes: |
    Version 9.1.1
    -------------

    - Extended release notes example.

    Version 9.1
    -----------

    The changelog for version 9.1 is summarized. For full details, we recommend reviewing the
    full set of SCM changes on GitHub.

    First, an important preface:
allowRollback
This defaults to false because most applications are tied to roll-forward database schemas.
Setting allowRollback: true will enable a “Rollback” button on the end-customer Verison History page.
Example:
allowRollback: true
statusInformers
When statusInformers are specified in the format [namespace/]type/name (where namespace is optional), the dashboard can provide timely feedback when the application deployment is complete and the application is ready for use. Multiple informers must be available for a Ready status.
Example:
statusInformers:
  - service/sentry
  - deployment/sentry-web
  - deployment/sentry-worker
NOTE: statusInformers entries support template functions. For example, a specific status informer can be excluded based on an application config value.
Example:
statusInformers:
    - deployment/my-web-svc
    - '{{repl if ConfigOptionEquals "option" "value"}}deployment/my-worker{{repl else}}{{repl end}}'
ports (optional)
When additional ports specified (in addition to the :8800 admin console port), the KOTS CLI will automatically port-forward connections to the deployed application when running the kots admin-console command.
serviceName- The name of the service that has aClusterIPtype that should receive the traffic.servicePort- TheClusterIPport to forward traffic to.localPort- If set, the port to map on the local workstation. If not set, this will be the same asservicePort.applicationUrl- This should match a service found in thek8s.ioApplication spec.
Example:
ports:
  - serviceName: web
    servicePort: 9000
    localPort: 9000
    applicationUrl: "http://web"
kubectlVersion (optional)
This defaults to latest.
Set to 1.14.9, 1.16.3 or a blang semver range (like >1.16.0 <1.17.0) to use a specific version of kubectl to apply your application’s yaml.
The latest version within the provided range will be used, falling back to the latest version if no version matches. Currently 1.14.9 and 1.16.3 are supported, but patch versions may change and newer minor versions may be added in the future.
kustomizeVersion (optional)
This defaults to latest, but can be changed to 3.5.4 to use a specific version of kustomize to render your app’s yaml. Currently only 3.5.4 is supported, but patch versions may change and newer versions may be added in the future.
requireMinimalRBACPrivileges (optional)
When set to true, this will instruct the KOTS installer to create a namespace-scoped Role and RoleBinding, instead of the default cluster-scoped ClusterRole and ClusterRoleBinding. For more information, see the RBAC documentation.
Example:
requireMinimalRBACPrivileges: true
additionalImages (optional)
An optional array of strings that reference images to be included in airgap bundles and pushed to the local registry during installation. While KOTS detects images from the PodSpecs in the application, some applications (Operators) may need to include additional images that will not be referenced until runtime.
Example:
additionalImages:
  - jenkins/jenkins:lts
graphs
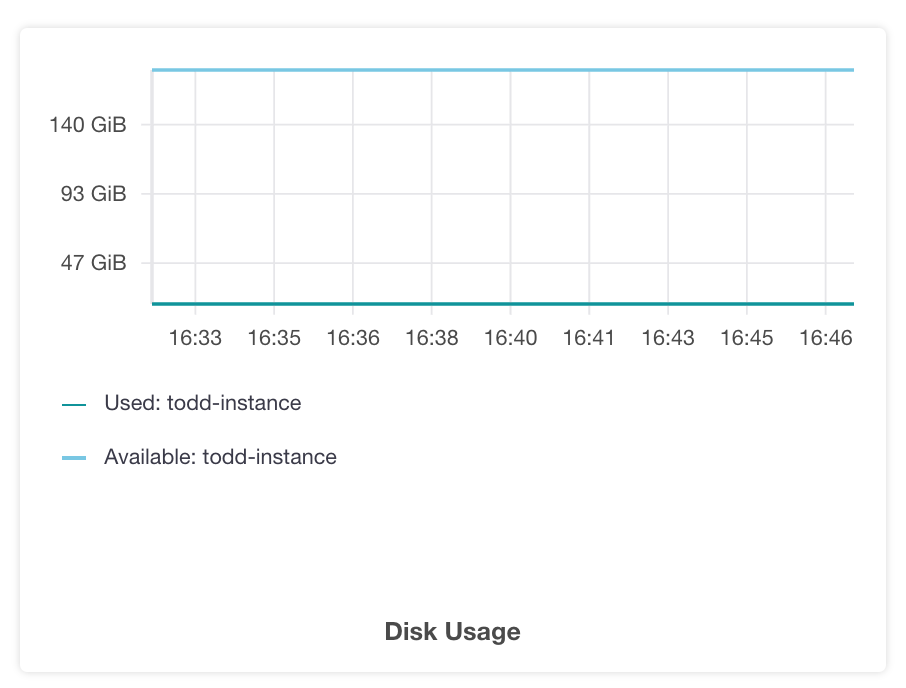
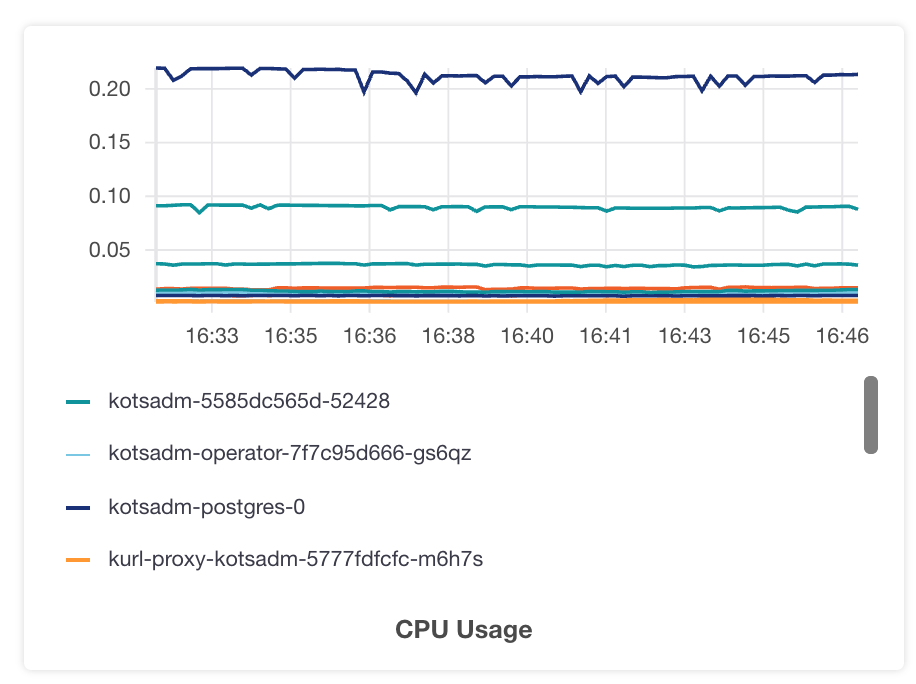
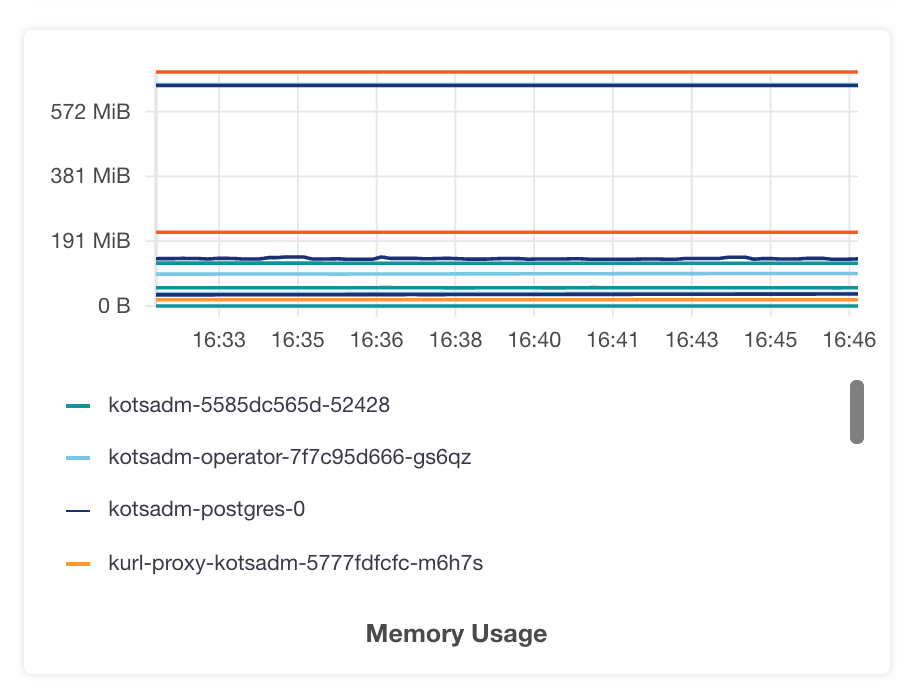
An optional graph configuration to include custom graphs on the KOTS Admin Console application dashboard. Three graphs are included by default: “Disk Usage”, “CPU Usage” and “Memory Usage”.
Configuring additional graphs can be done by providing the following values:
title- the graph title.query- the Prometheus query.legend- The legend to use for the query line. This can be templated with each element returned from the Prometheus query by using the template escape sequence:{{}}.queries- An optional list of queries containing a query and legend.query:The Prometheus querylegend:The legend to use for the query line. Can be templated with each element returned from the Prometheus query. Template escape sequence is{{}}.
yAxisFormat- the format of the Y axis labels with support for all Grafana units.yAxisTemplate- Y axis labels template. Use{{ value }}.
Examples:
graphs:
  - title: User Signups
    query: 'sum(user_signup_events_total)'
graphs:
  - title:  "CPU Usage"
    query: "sum(rate(container_cpu_usage_seconds_total{namespace="default",container!="POD",pod!=""}[5m])) by (pod)"
    legend: "{{ pod }}"
graphs:
  - title: "Memory Usage"
    query: "sum(container_memory_usage_bytes{namespace="default",container!="POD",pod!=""}) by (pod)"
    legend: "{{ pod }}"
    YAxisFormat: "bytes"